
Global manufacturing solutions provider Flex (NASDAQ:FLEX) reported Q2 CY2025 results topping the market’s revenue expectations, with sales up 4.1% year on year to $6.58 billion. Guidance for next quarter’s revenue was better than expected at $6.65 billion at the midpoint, 1.8% above analysts’ estimates. Its non-GAAP profit of $0.72 per share was 12.3% above analysts’ consensus estimates.
Is now the time to buy Flex? Find out by accessing our full research report, it’s free.
Flex (FLEX) Q2 CY2025 Highlights:
- Revenue: $6.58 billion vs analyst estimates of $6.27 billion (4.1% year-on-year growth, 4.9% beat)
- Adjusted EPS: $0.72 vs analyst estimates of $0.64 (12.3% beat)
- Adjusted EBITDA: $487 million vs analyst estimates of $491.7 million (7.4% margin, 1% miss)
- The company lifted its revenue guidance for the full year to $26.5 billion at the midpoint from $25.9 billion, a 2.3% increase
- Management raised its full-year Adjusted EPS guidance to $2.96 at the midpoint, a 1.7% increase
- Operating Margin: 4.7%, up from 3.7% in the same quarter last year
- Free Cash Flow Margin: 4%, similar to the same quarter last year
- Market Capitalization: $20.11 billion
"Our first quarter results are a great start to FY26 and a testament to the strength of our strategic focus on high-growth end-markets like data center and power," said Revathi Advaithi, CEO of Flex.
Company Overview
Originally known as Flextronics until its 2016 rebranding, Flex (NASDAQ:FLEX) is a global manufacturing partner that designs, engineers, and builds products for companies across industries from medical devices to solar trackers.
Revenue Growth
Reviewing a company’s long-term sales performance reveals insights into its quality. Any business can put up a good quarter or two, but many enduring ones grow for years.
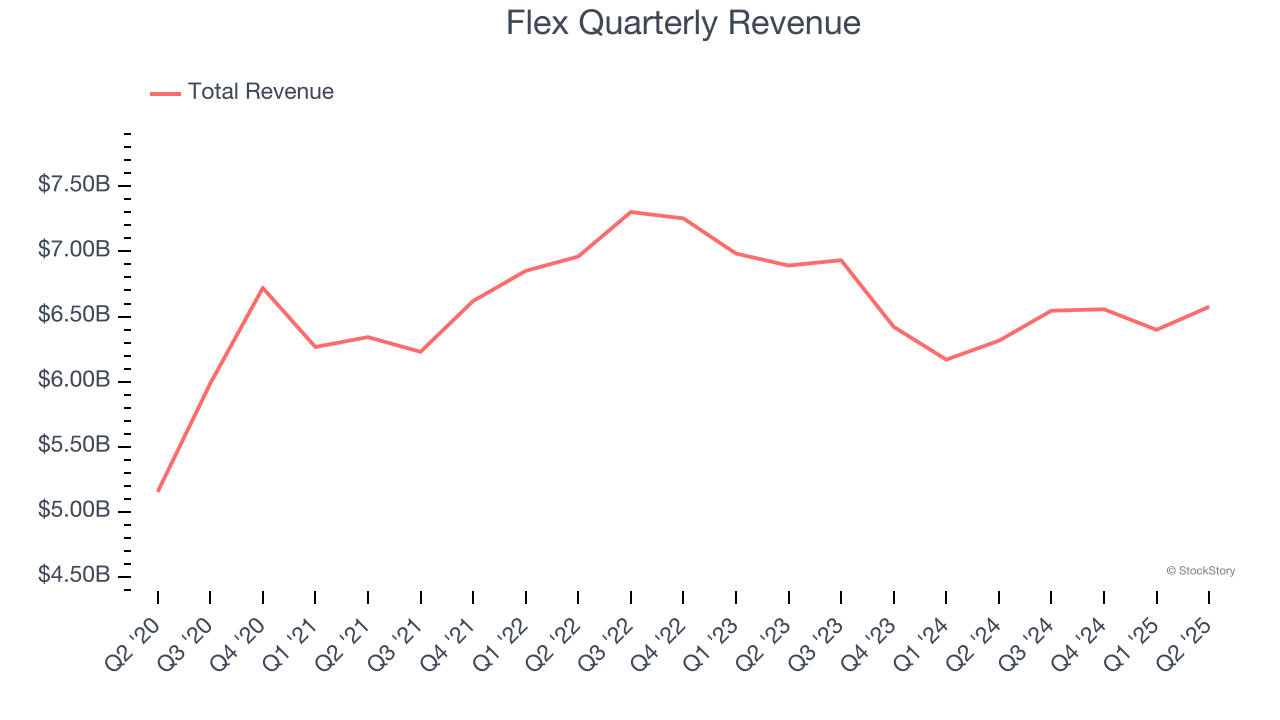
With $26.07 billion in revenue over the past 12 months, Flex is a behemoth in the business services sector and benefits from economies of scale, giving it an edge in distribution. This also enables it to gain more leverage on its fixed costs than smaller competitors and the flexibility to offer lower prices. However, its scale is a double-edged sword because finding new avenues for growth becomes difficult when you already have a substantial market presence. To accelerate sales, Flex likely needs to optimize its pricing or lean into new offerings and international expansion.
As you can see below, Flex’s 2.4% annualized revenue growth over the last five years was sluggish. This shows it failed to generate demand in any major way and is a rough starting point for our analysis.
We at StockStory place the most emphasis on long-term growth, but within business services, a half-decade historical view may miss recent innovations or disruptive industry trends. Flex’s performance shows it grew in the past but relinquished its gains over the last two years, as its revenue fell by 4.2% annually. 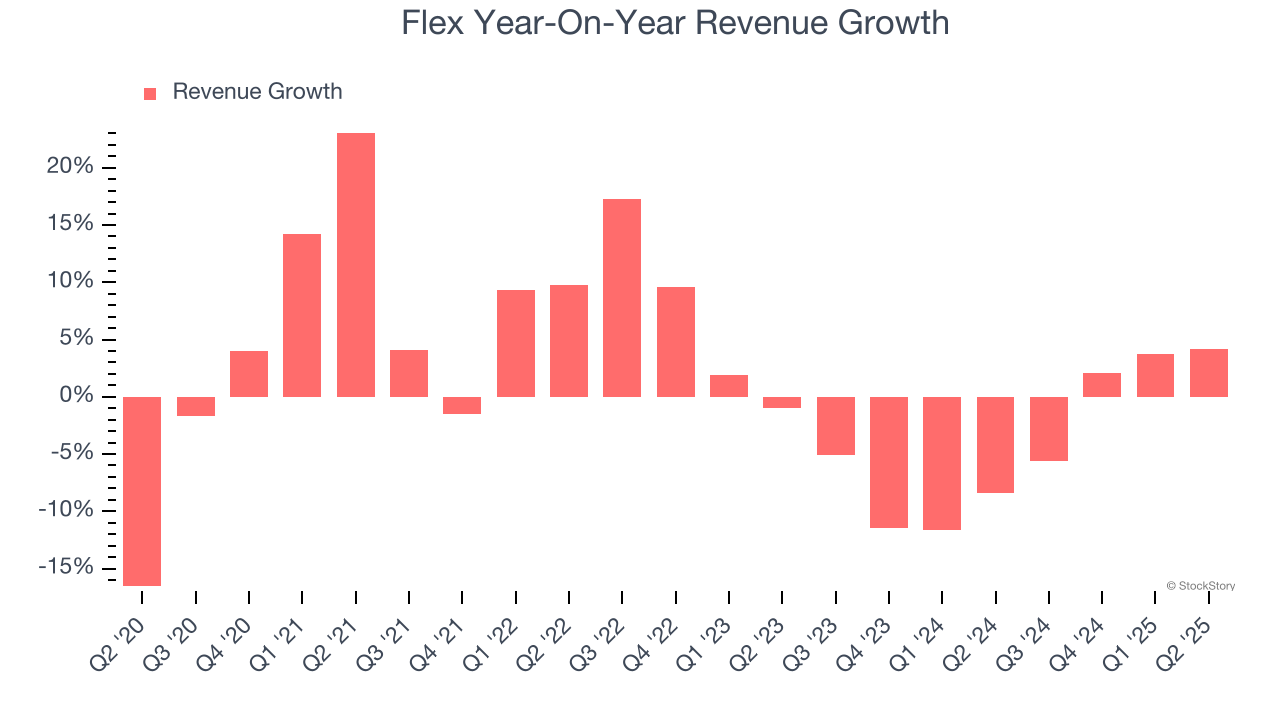
This quarter, Flex reported modest year-on-year revenue growth of 4.1% but beat Wall Street’s estimates by 4.9%. Company management is currently guiding for a 1.6% year-on-year increase in sales next quarter.
Looking further ahead, sell-side analysts expect revenue to grow 1.4% over the next 12 months. Although this projection implies its newer products and services will catalyze better top-line performance, it is still below average for the sector.
Software is eating the world and there is virtually no industry left that has been untouched by it. That drives increasing demand for tools helping software developers do their jobs, whether it be monitoring critical cloud infrastructure, integrating audio and video functionality, or ensuring smooth content streaming. Click here to access a free report on our 3 favorite stocks to play this generational megatrend.
Operating Margin
Operating margin is one of the best measures of profitability because it tells us how much money a company takes home after subtracting all core expenses, like marketing and R&D.
Flex was profitable over the last five years but held back by its large cost base. Its average operating margin of 3.8% was weak for a business services business.
On the plus side, Flex’s operating margin rose by 1 percentage points over the last five years, as its sales growth gave it operating leverage.
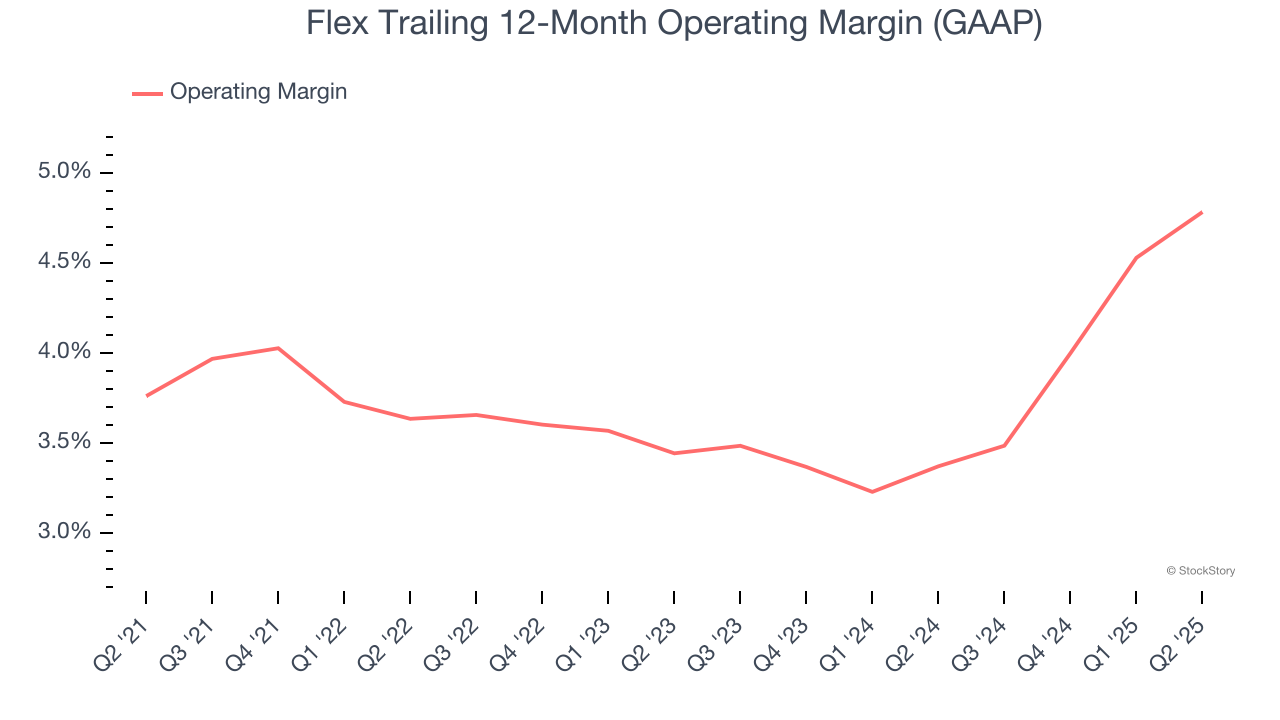
This quarter, Flex generated an operating margin profit margin of 4.7%, up 1 percentage points year on year. This increase was a welcome development and shows it was more efficient.
Earnings Per Share
Revenue trends explain a company’s historical growth, but the long-term change in earnings per share (EPS) points to the profitability of that growth – for example, a company could inflate its sales through excessive spending on advertising and promotions.
Flex’s EPS grew at an astounding 19% compounded annual growth rate over the last five years, higher than its 2.4% annualized revenue growth. This tells us the company became more profitable on a per-share basis as it expanded.
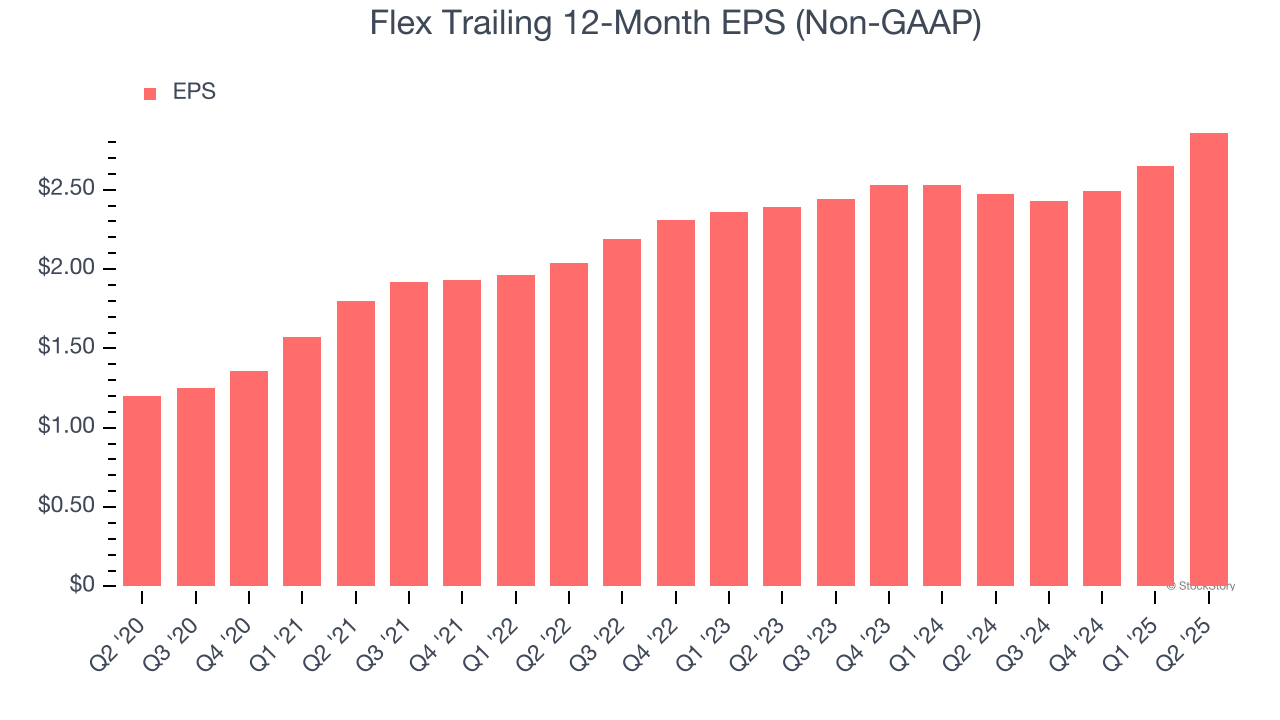
We can take a deeper look into Flex’s earnings quality to better understand the drivers of its performance. As we mentioned earlier, Flex’s operating margin expanded by 1 percentage points over the last five years. On top of that, its share count shrank by 24.1%. These are positive signs for shareholders because improving profitability and share buybacks turbocharge EPS growth relative to revenue growth. 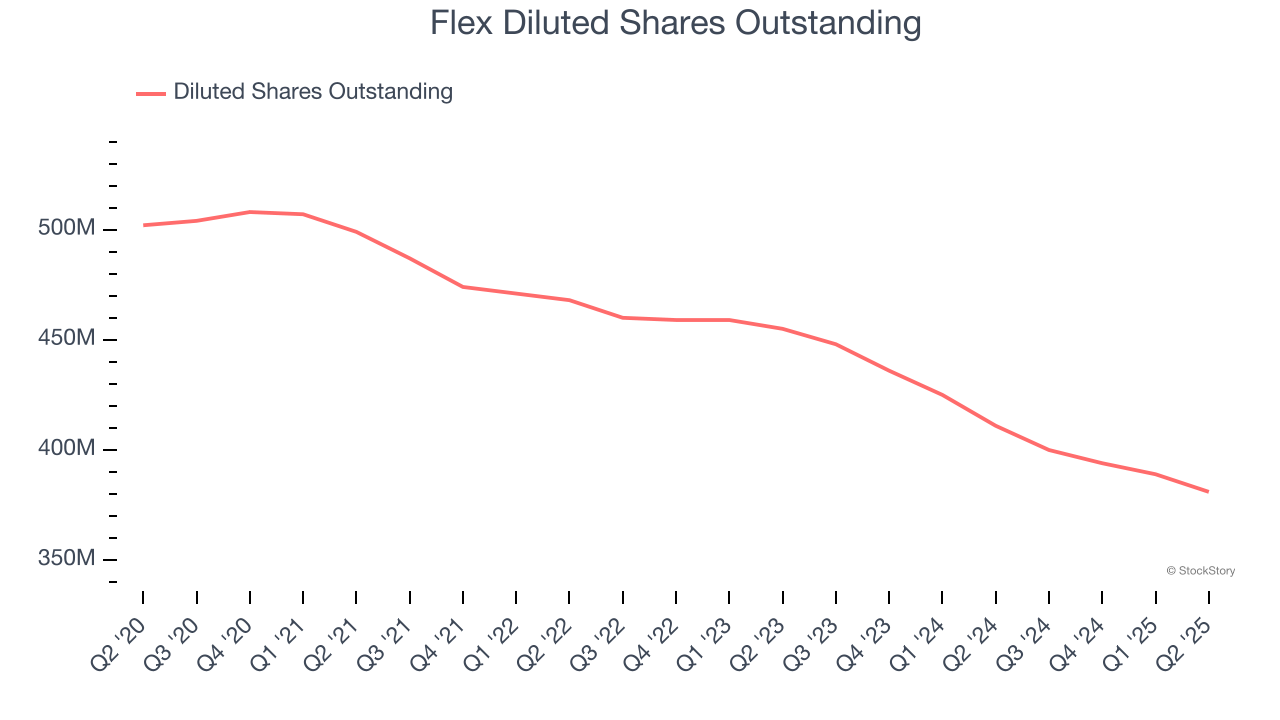
Like with revenue, we analyze EPS over a shorter period to see if we are missing a change in the business.
For Flex, its two-year annual EPS growth of 9.4% was lower than its five-year trend. We hope its growth can accelerate in the future.
In Q2, Flex reported EPS at $0.72, up from $0.51 in the same quarter last year. This print easily cleared analysts’ estimates, and shareholders should be content with the results. We also like to analyze expected EPS growth based on Wall Street analysts’ consensus projections, but there is insufficient data.
Key Takeaways from Flex’s Q2 Results
We enjoyed seeing Flex beat analysts’ revenue and EPS expectations this quarter. We were also glad it raised its full-year revenue and EPS guidance. Zooming out, we think this was a good print with some key areas of upside. Investors were likely hoping for more, and shares traded down 4.7% to $51.29 immediately following the results.
Is Flex an attractive investment opportunity at the current price? If you’re making that decision, you should consider the bigger picture of valuation, business qualities, as well as the latest earnings. We cover that in our actionable full research report which you can read here, it’s free.