
DALLAS, Texas, July 23, 2025 (GLOBE NEWSWIRE) -- Texas new home sales showed a slight decline in June as the market adjusts to seasonal and affordability pressures, according to the latest Texas New Home Sales Report released today by HomesUSA.com and its founder and CEO, Ben Caballero, the nation’s top-ranked real estate agent.
The HomesUSA.com New Home Sales Report uses Multiple Listing Service data – the most comprehensive, current, and accurate information – from the Realtor Associations of North Texas, Houston, Austin, and San Antonio. All averages are based on three-month rolling averages to reduce short-term volatility and anomalies.
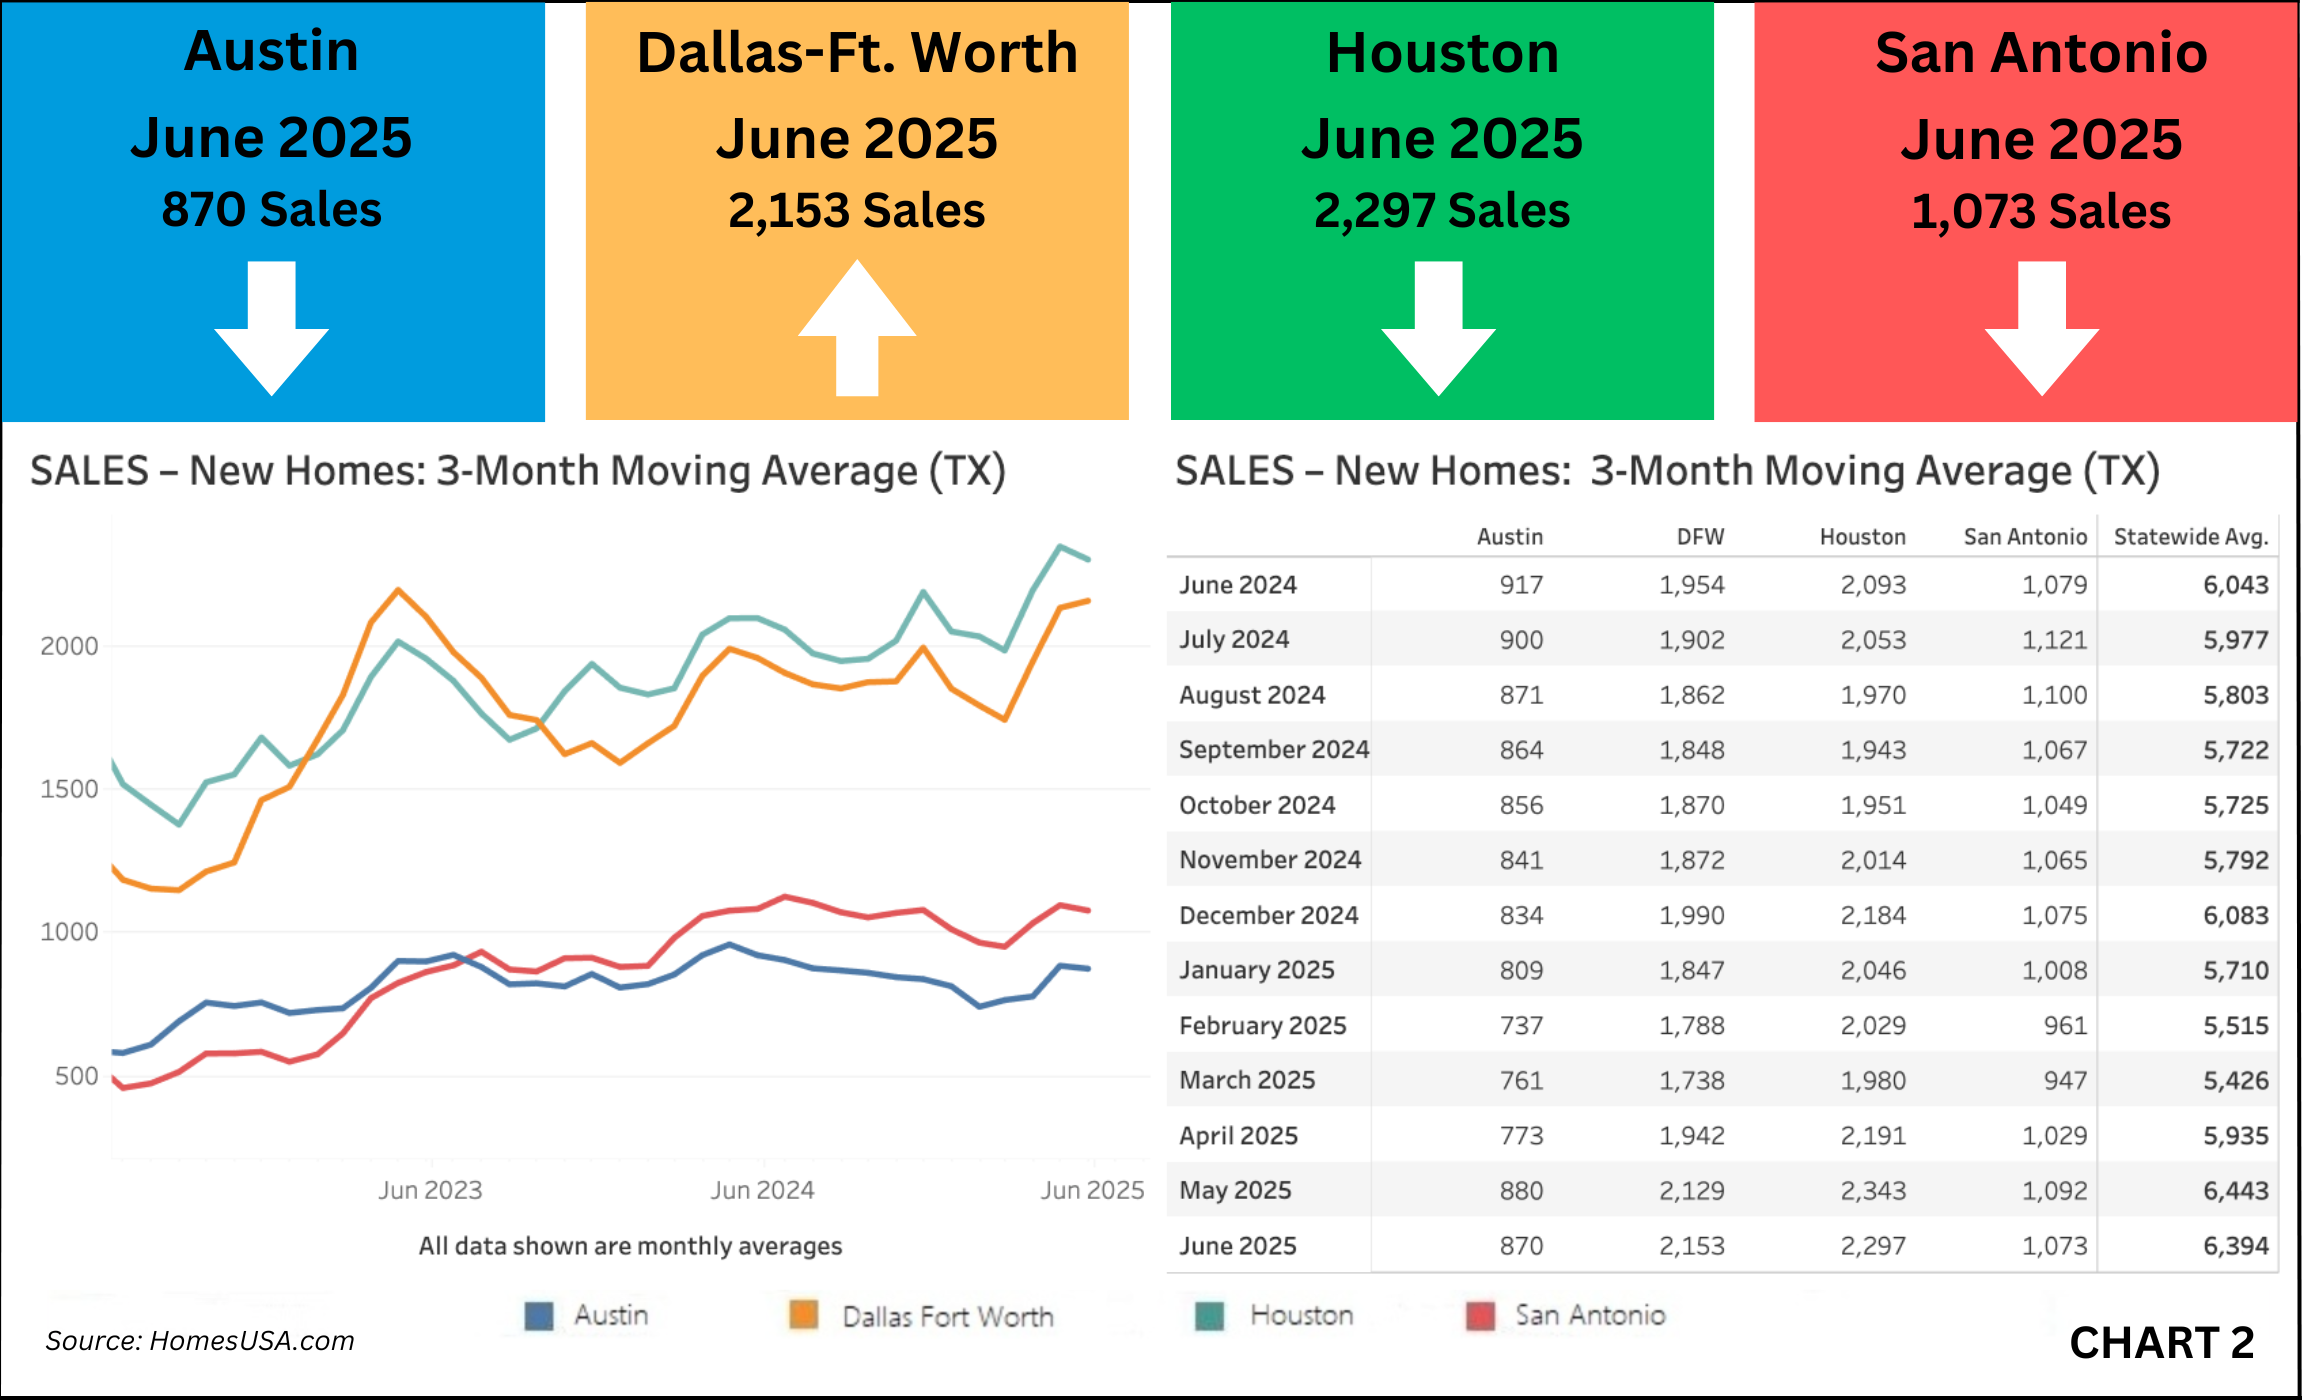
HomesUSA.com reports the three-month moving average of new home sales statewide dipped in June to 6,394, down from 6,443 in May. Houston posted 2,297 sales, a slight decline from 2,343 the previous month. Austin’s average slipped to 870 from 880, and San Antonio reported 1,073 new home sales versus 1,092 in May. In contrast, Dallas-Ft. Worth new home sales slightly rose in June to 2,153 sales versus 2,129 in May.
“With June sales down in three of Texas’ four largest markets and pending sales down in all four of its major markets, the numbers confirm my expectation that Texas 2025 new home sales likely peaked in May,” said Ben Caballero, founder and CEO of HomesUSA.com. “If historical trends prevail as I expect them to, Texas new home prices and sales numbers will drift downward for the remainder of the year.”
Caballero added a qualifier: “Unless, of course, mortgage rates fall, then I would expect Texas home sales to strengthen.”
According to HomesUSA.com’s proprietary Texas New Home Sales Index, the pace of new home sales improved as the statewide average Days on Market fell to 108.19 days in June from 111.81 days in May, another positive signal that buyers are responding more quickly to listings.
![]()
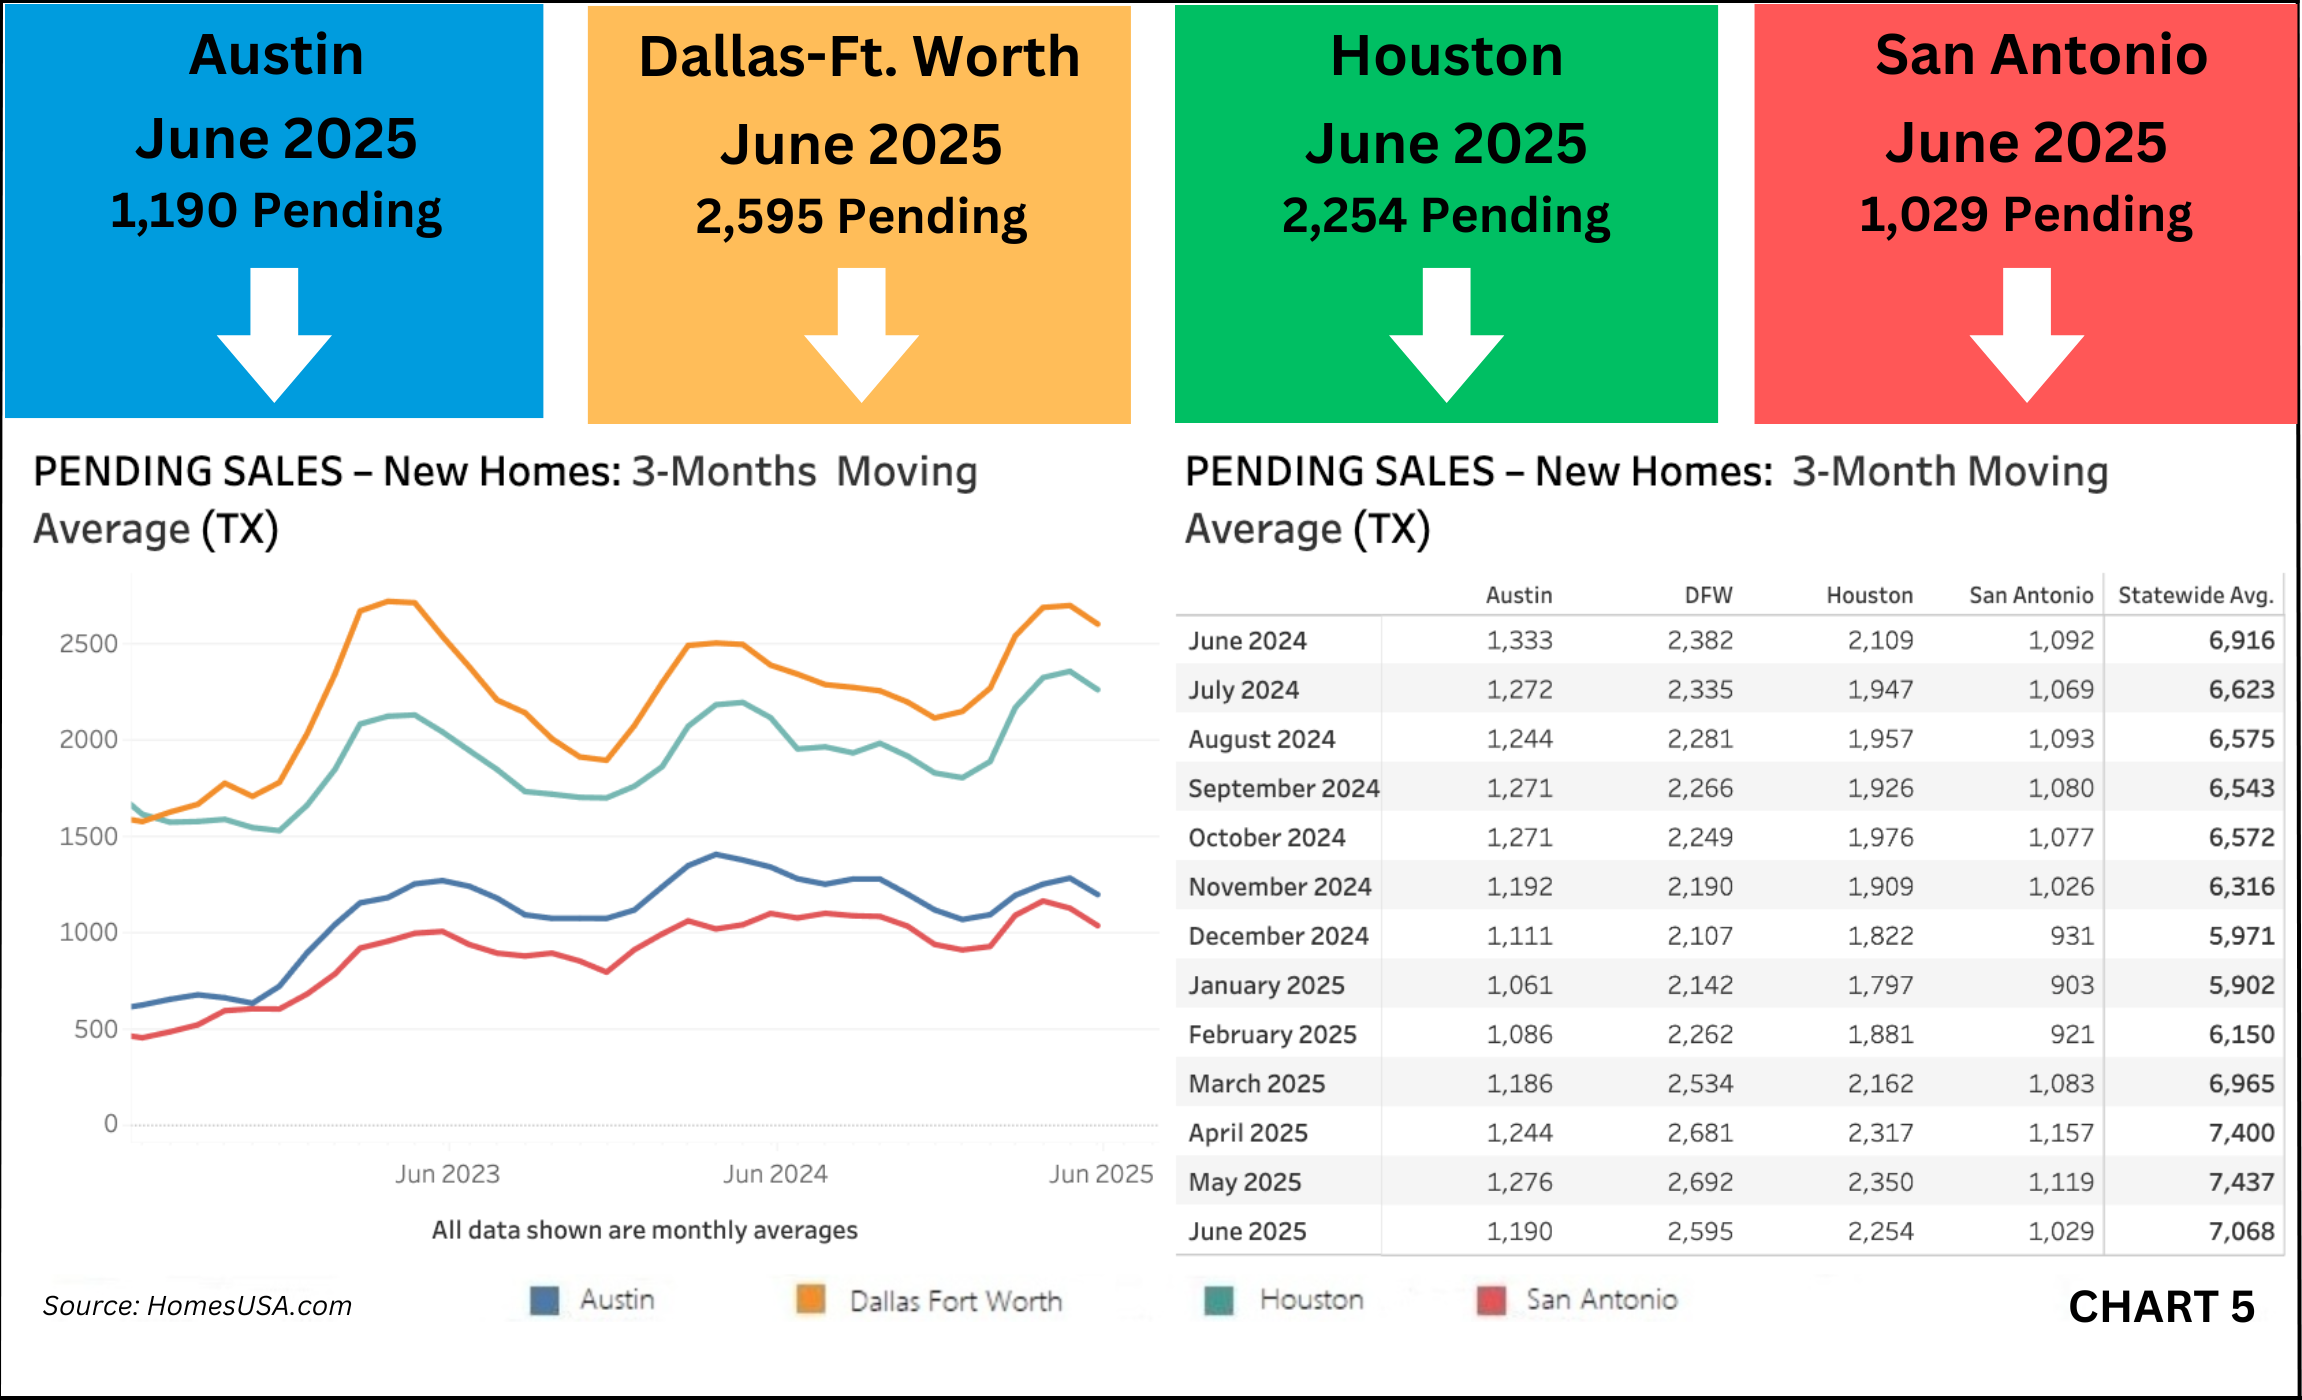
Pending new home sales, a leading indicator of future closings, declined statewide. The three-month moving average for June was 7,068 pending sales, down from 7,437 in May. While the decrease was modest, all four major markets experienced month-over-month declines.
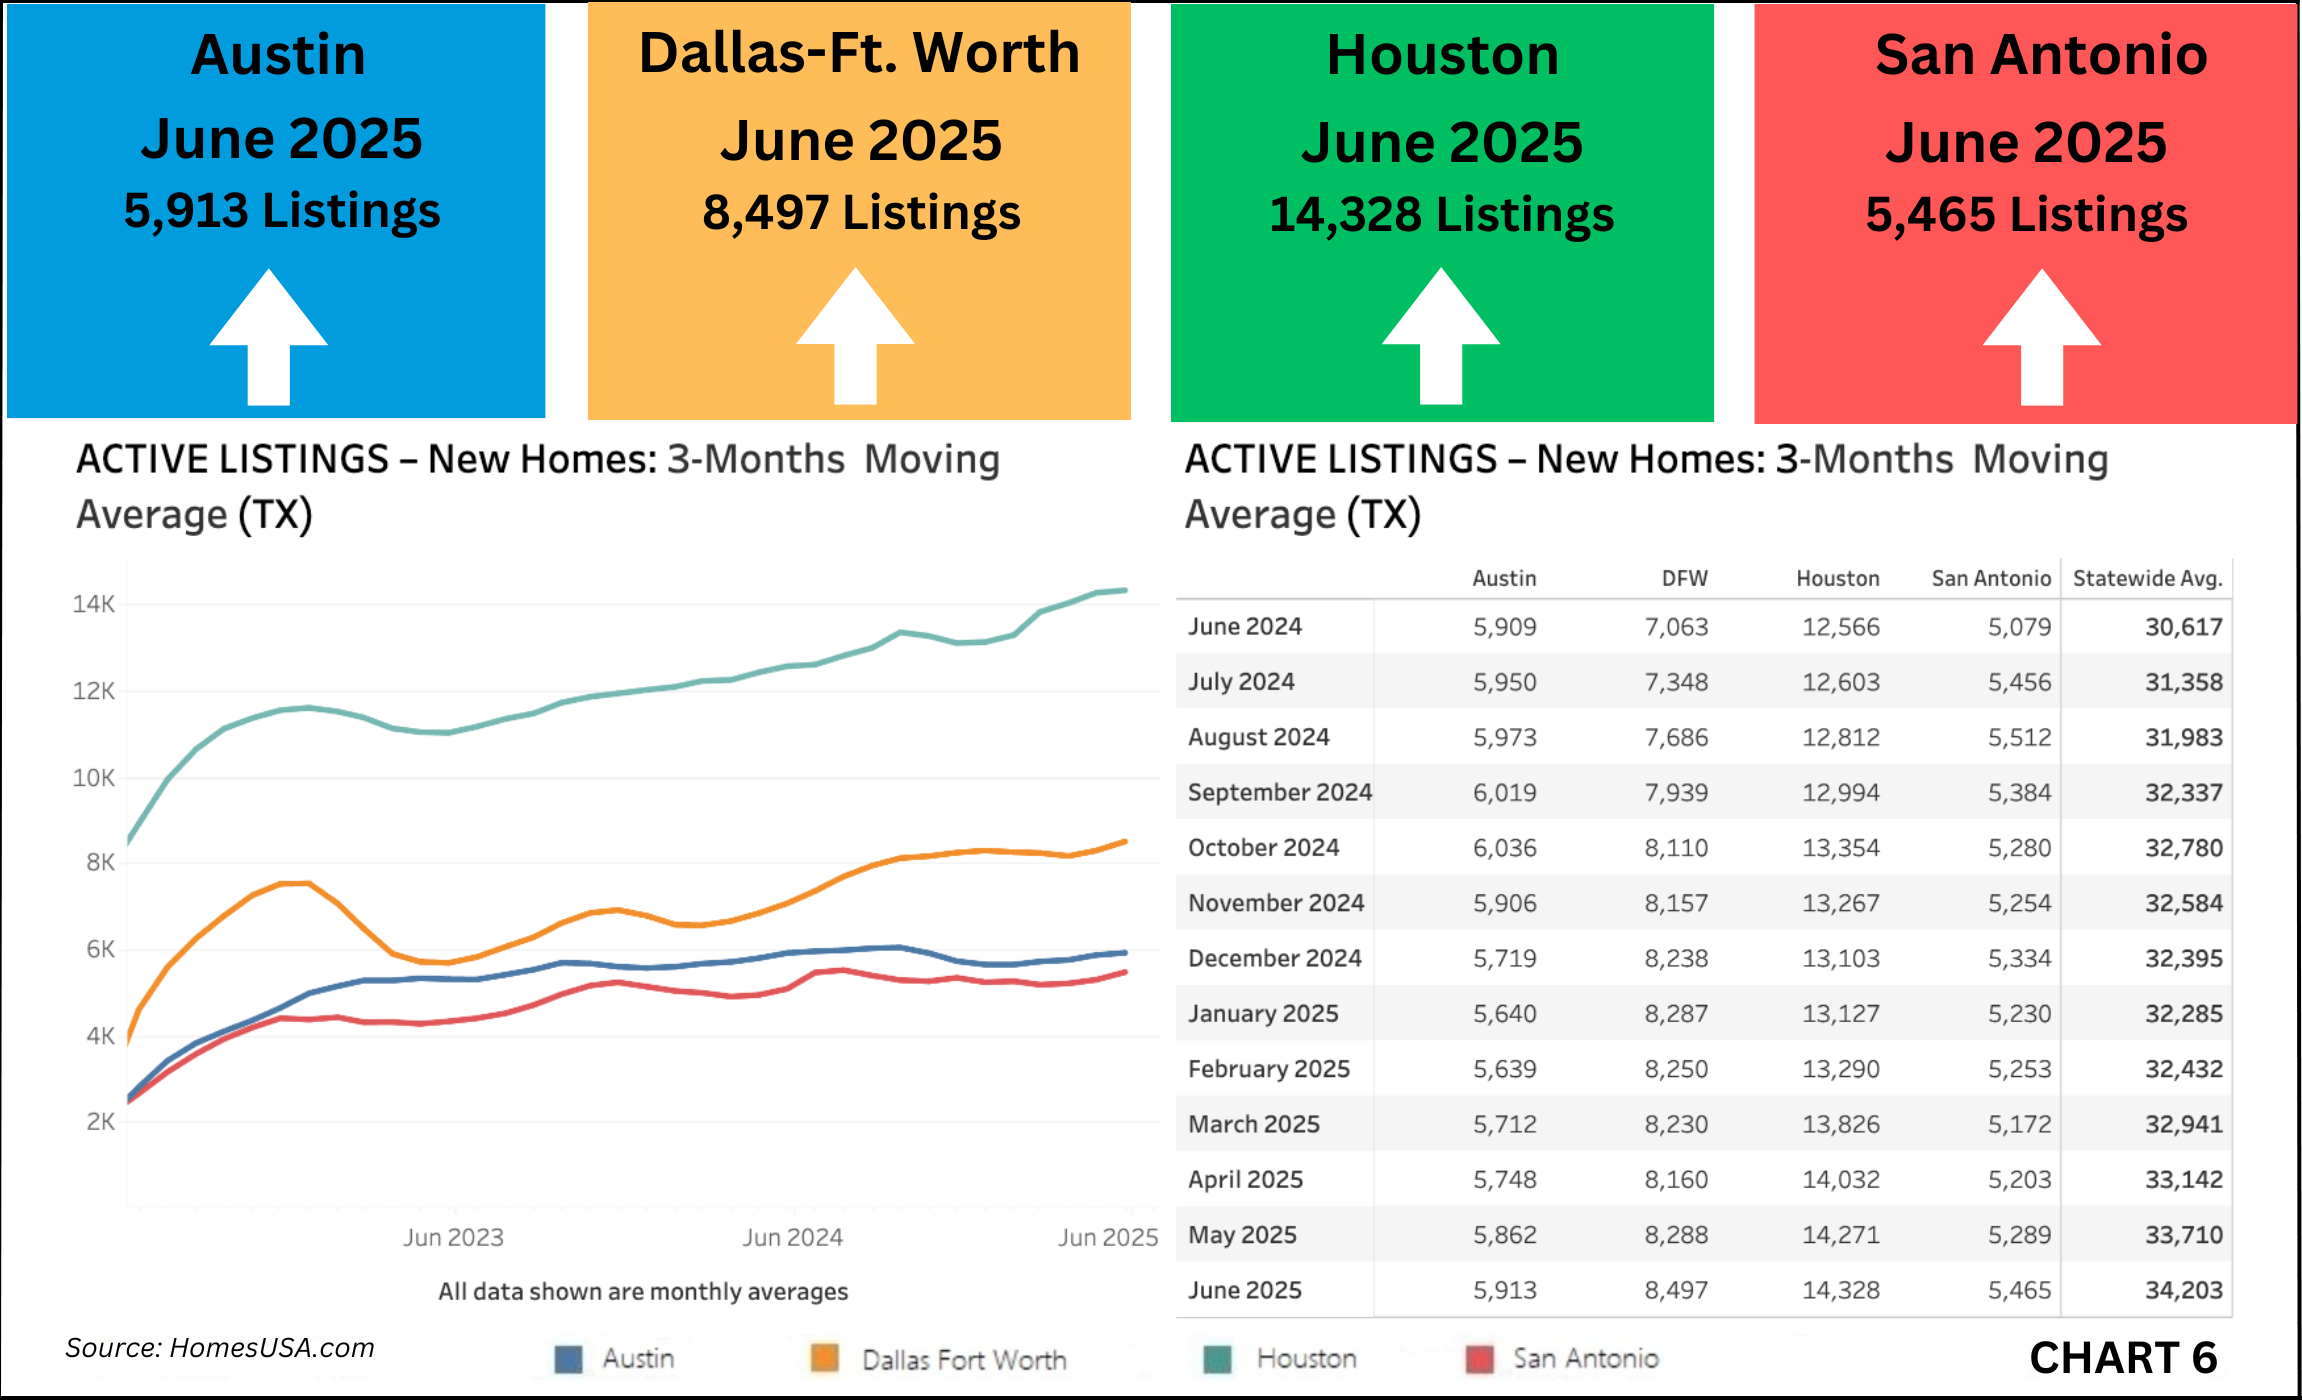
Inventory continued to expand across Texas, as active new home listings rose to 34,203 in June from 33,710 in May. This steady growth in available properties suggests builders are maintaining strong construction activity while keeping pace with demand.
HomesUSA.com is sharing its Texas New Home Sales Report and New Home Sales Index at the same time the Commerce Department releases its nationwide New Residential Sales Report for June, set for Wednesday, July 24, 2025, at 10:00 am Eastern time.
About the Report
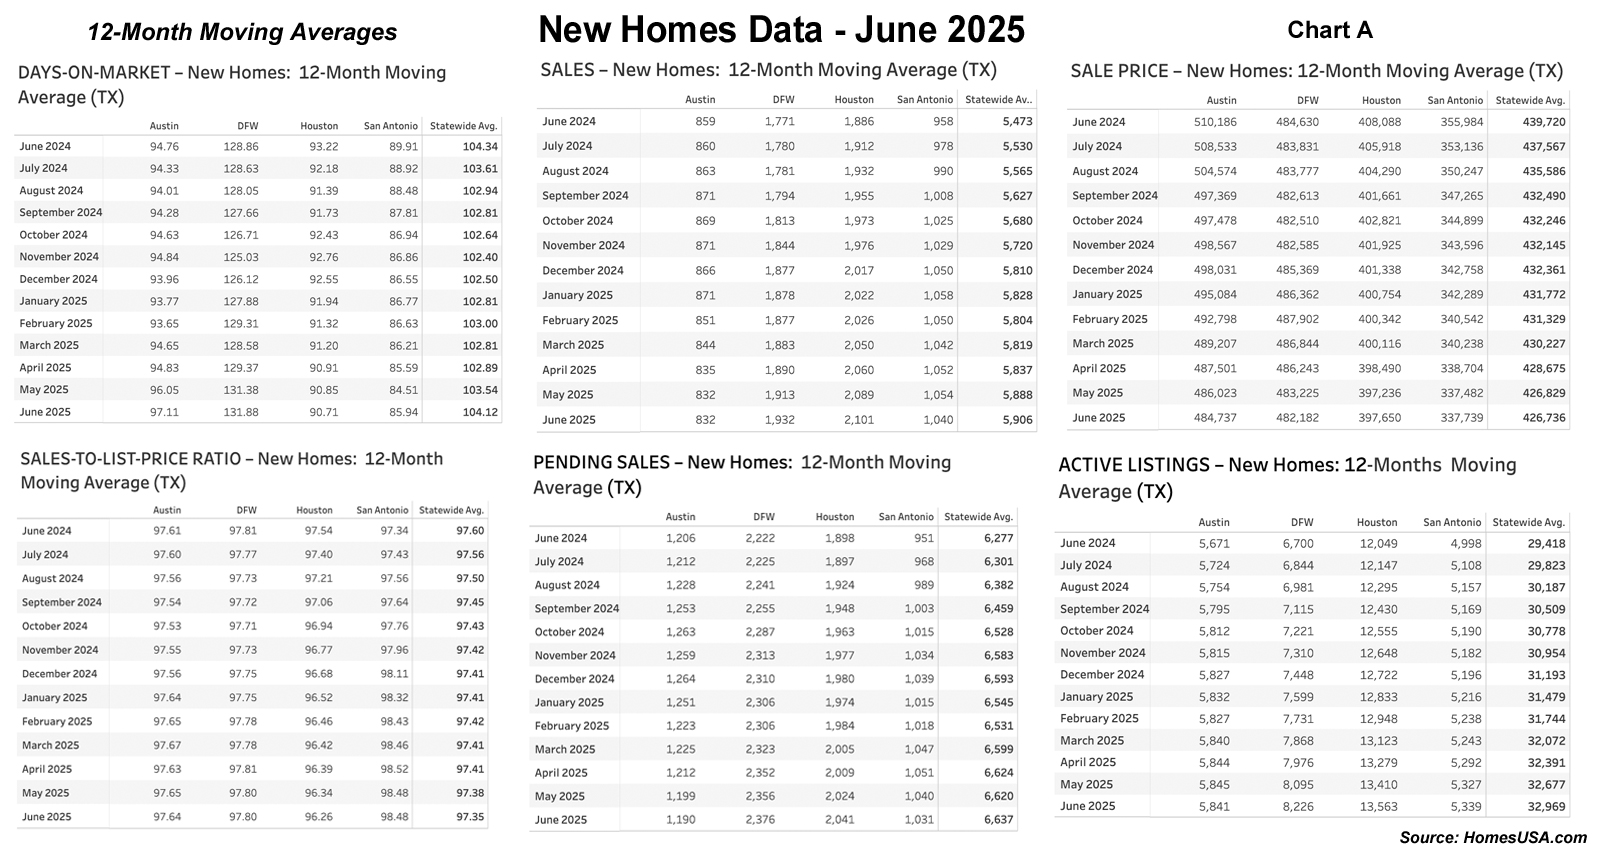
The HomesUSA.com monthly report covers closed sales recorded in MLSs by the 10th day of the following month. The report features 3-month and 12-month moving averages for six essential market data, including DOM, sales volume, sales prices, a sales-to-list price ratio, pending sales, and active listings. Caballero explained the 3-month moving average indices track market seasonality, while the 12-month moving average removes the seasonality and tracks the longer trend.
Days on Market Improves – New Homes in Texas (Exclusive Data)
The HomesUSA.com New Home Sales Index showed that the pace of new home sales quickened in June, as the average number of Days on Market declined statewide. The 3-month moving average for Texas dropped to 108.19 days from 111.81 days in May.
Among the state’s four major new home markets, Austin posted the largest improvement, with its DOM falling to 100.61 days, down from 103.56 days the previous month. Dallas-Ft. Worth also saw a significant improvement, with its DOM dropping to 136.39 days from 143.13 days. Houston’s DOM also declined to 92.69 days, compared to 96.26 days in May. San Antonio was the exception as its DOM rose modestly, increasing to 91.52 days from 90.77 days.
New homes typically spend more time on the market than existing homes because many are listed while still under construction. Note: Each MLS may calculate Days on Market differently, so direct comparisons may not always be reliable. (See Chart 1: Texas New Homes Days on Market)
Texas New Home Sales Decreases
Based on all local MLS data – the most reliable and current source of home sales activity total new home sales decreased in three of the four largest new home markets statewide last month. In Houston, the 3-month moving average of new home sales was 2,297 sales in June, a marginal decline from 2,343 in May. In Austin, the average dropped to 870 from 880, and San Antonio posted 1,073 sales, down from 1,092 the previous month. Dallas-Ft. Worth was the anomaly, as new home sales in June were 2,153, up slightly from 2,129 in May (See Chart 2: Texas New Home Sales)
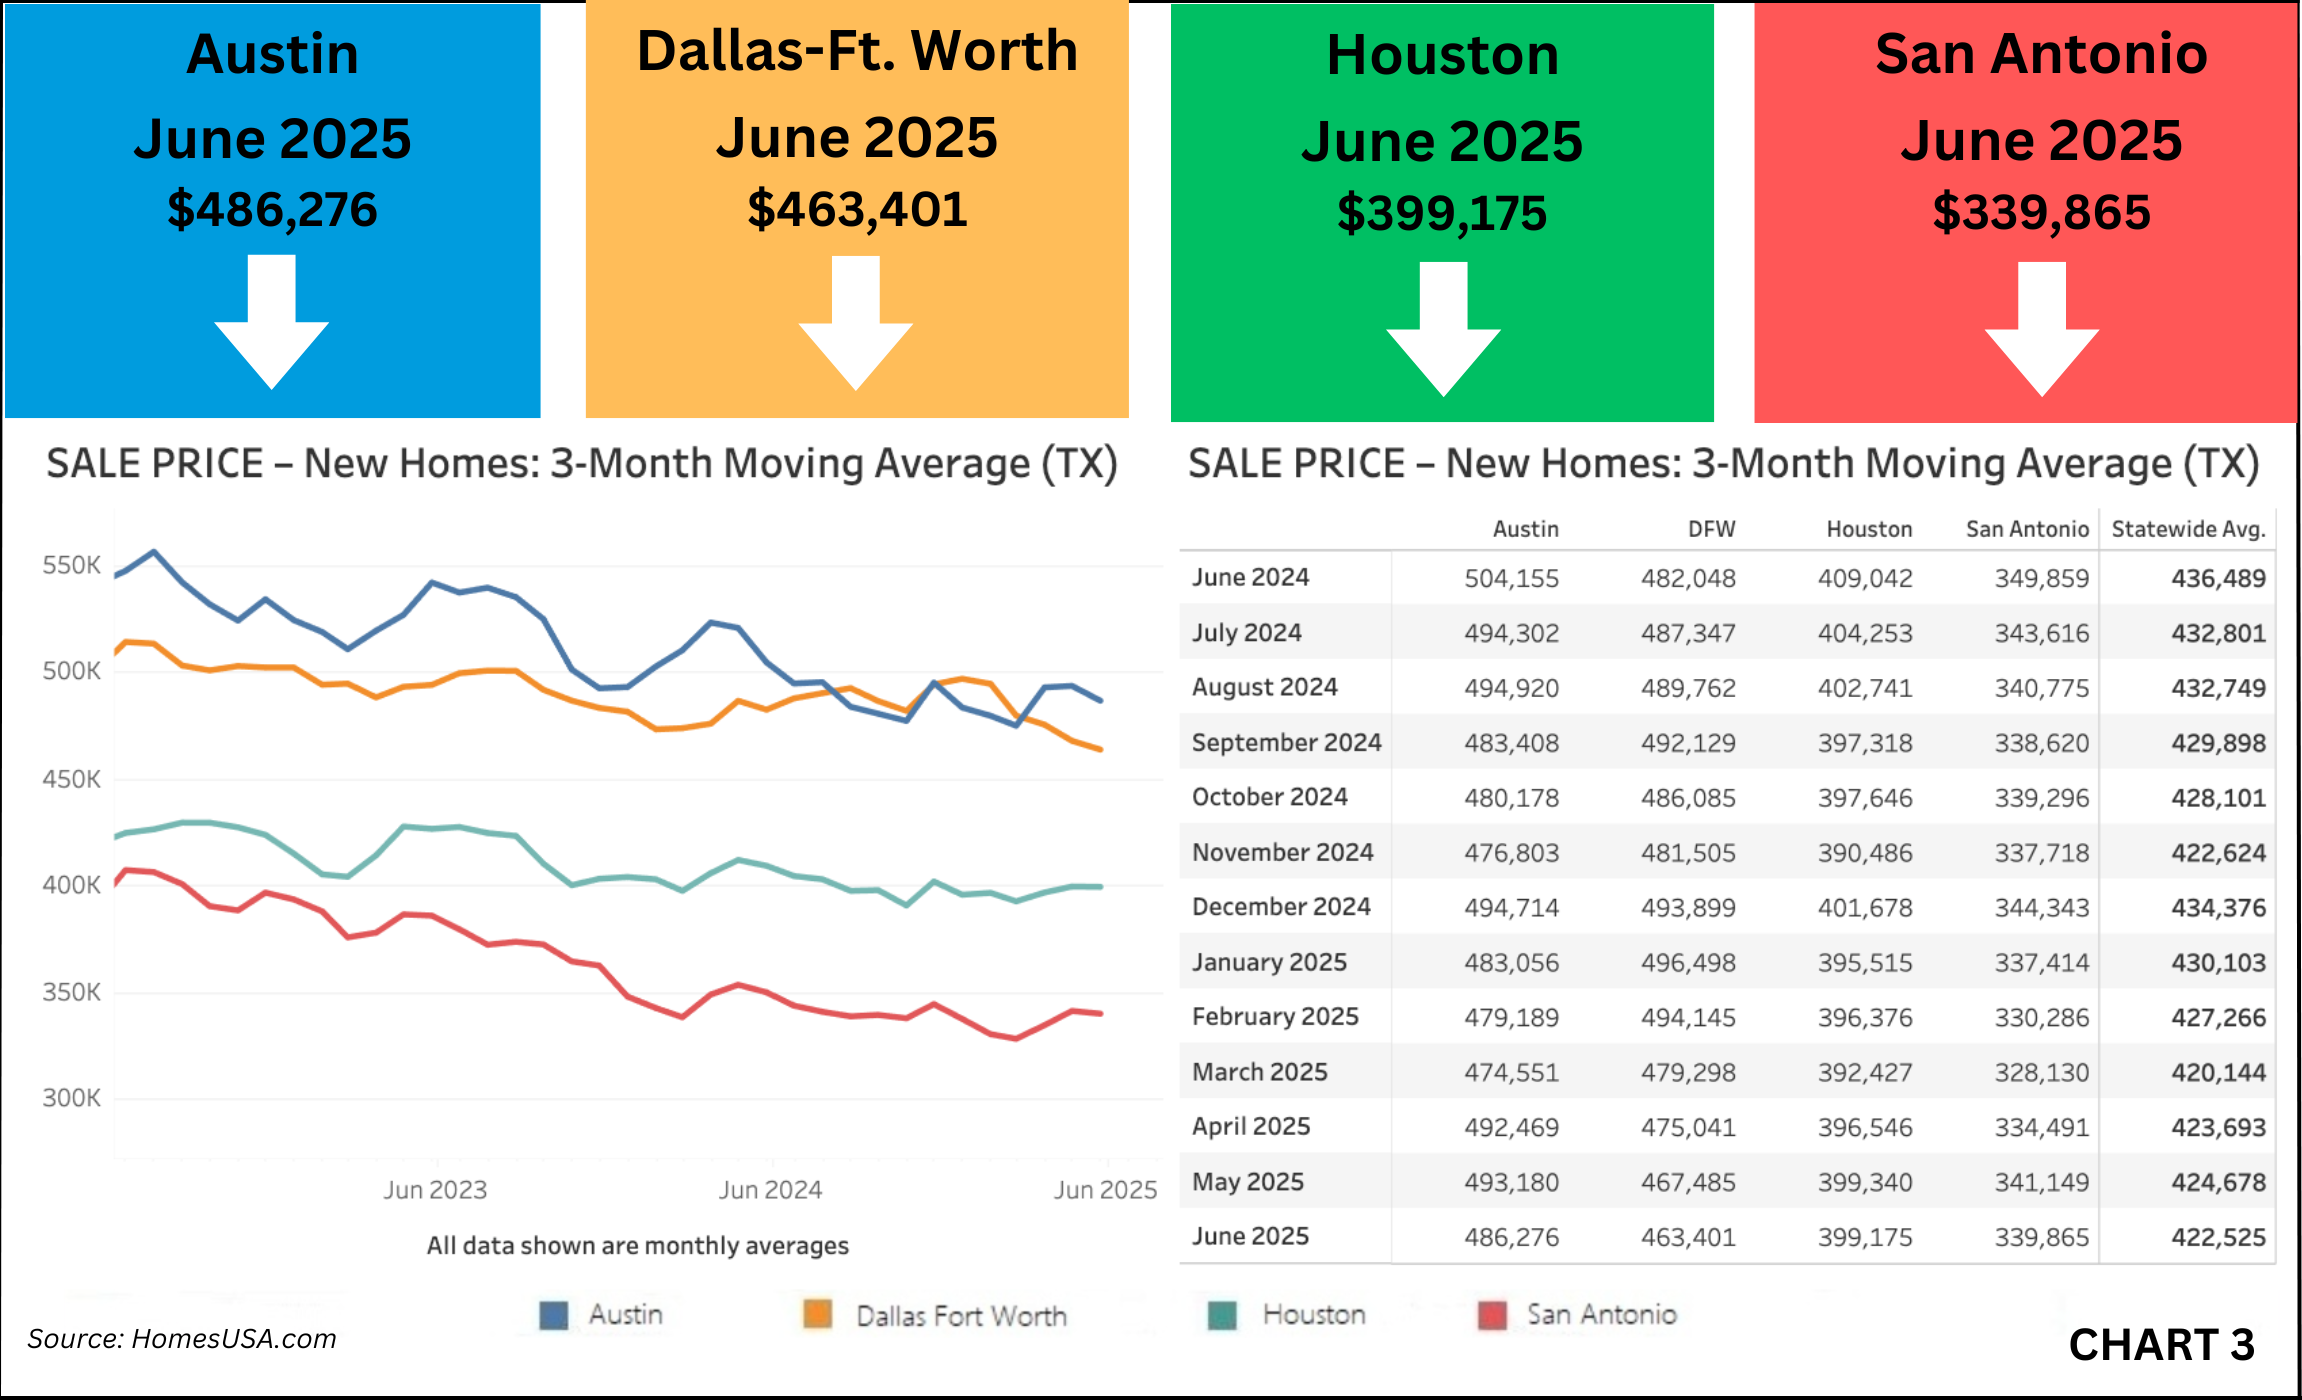
Texas New Home Prices Dip Modestly
Average new home prices in Texas declined modestly in June. The statewide 3-month moving average fell to $422,525 from $424,678 in May. Austin remained the most expensive new home market in the state, with an average price of $486,276, down from $493,180 the previous month. Dallas-Ft. Worth’s average price fell to $463,401 from $467,485. Houston’s average new home price declined to $399,175 from $399,340, and San Antonio, the most affordable of the four major markets, posted an average of $339,865, down from $341,149. (See Chart 3: Texas New Home Prices)
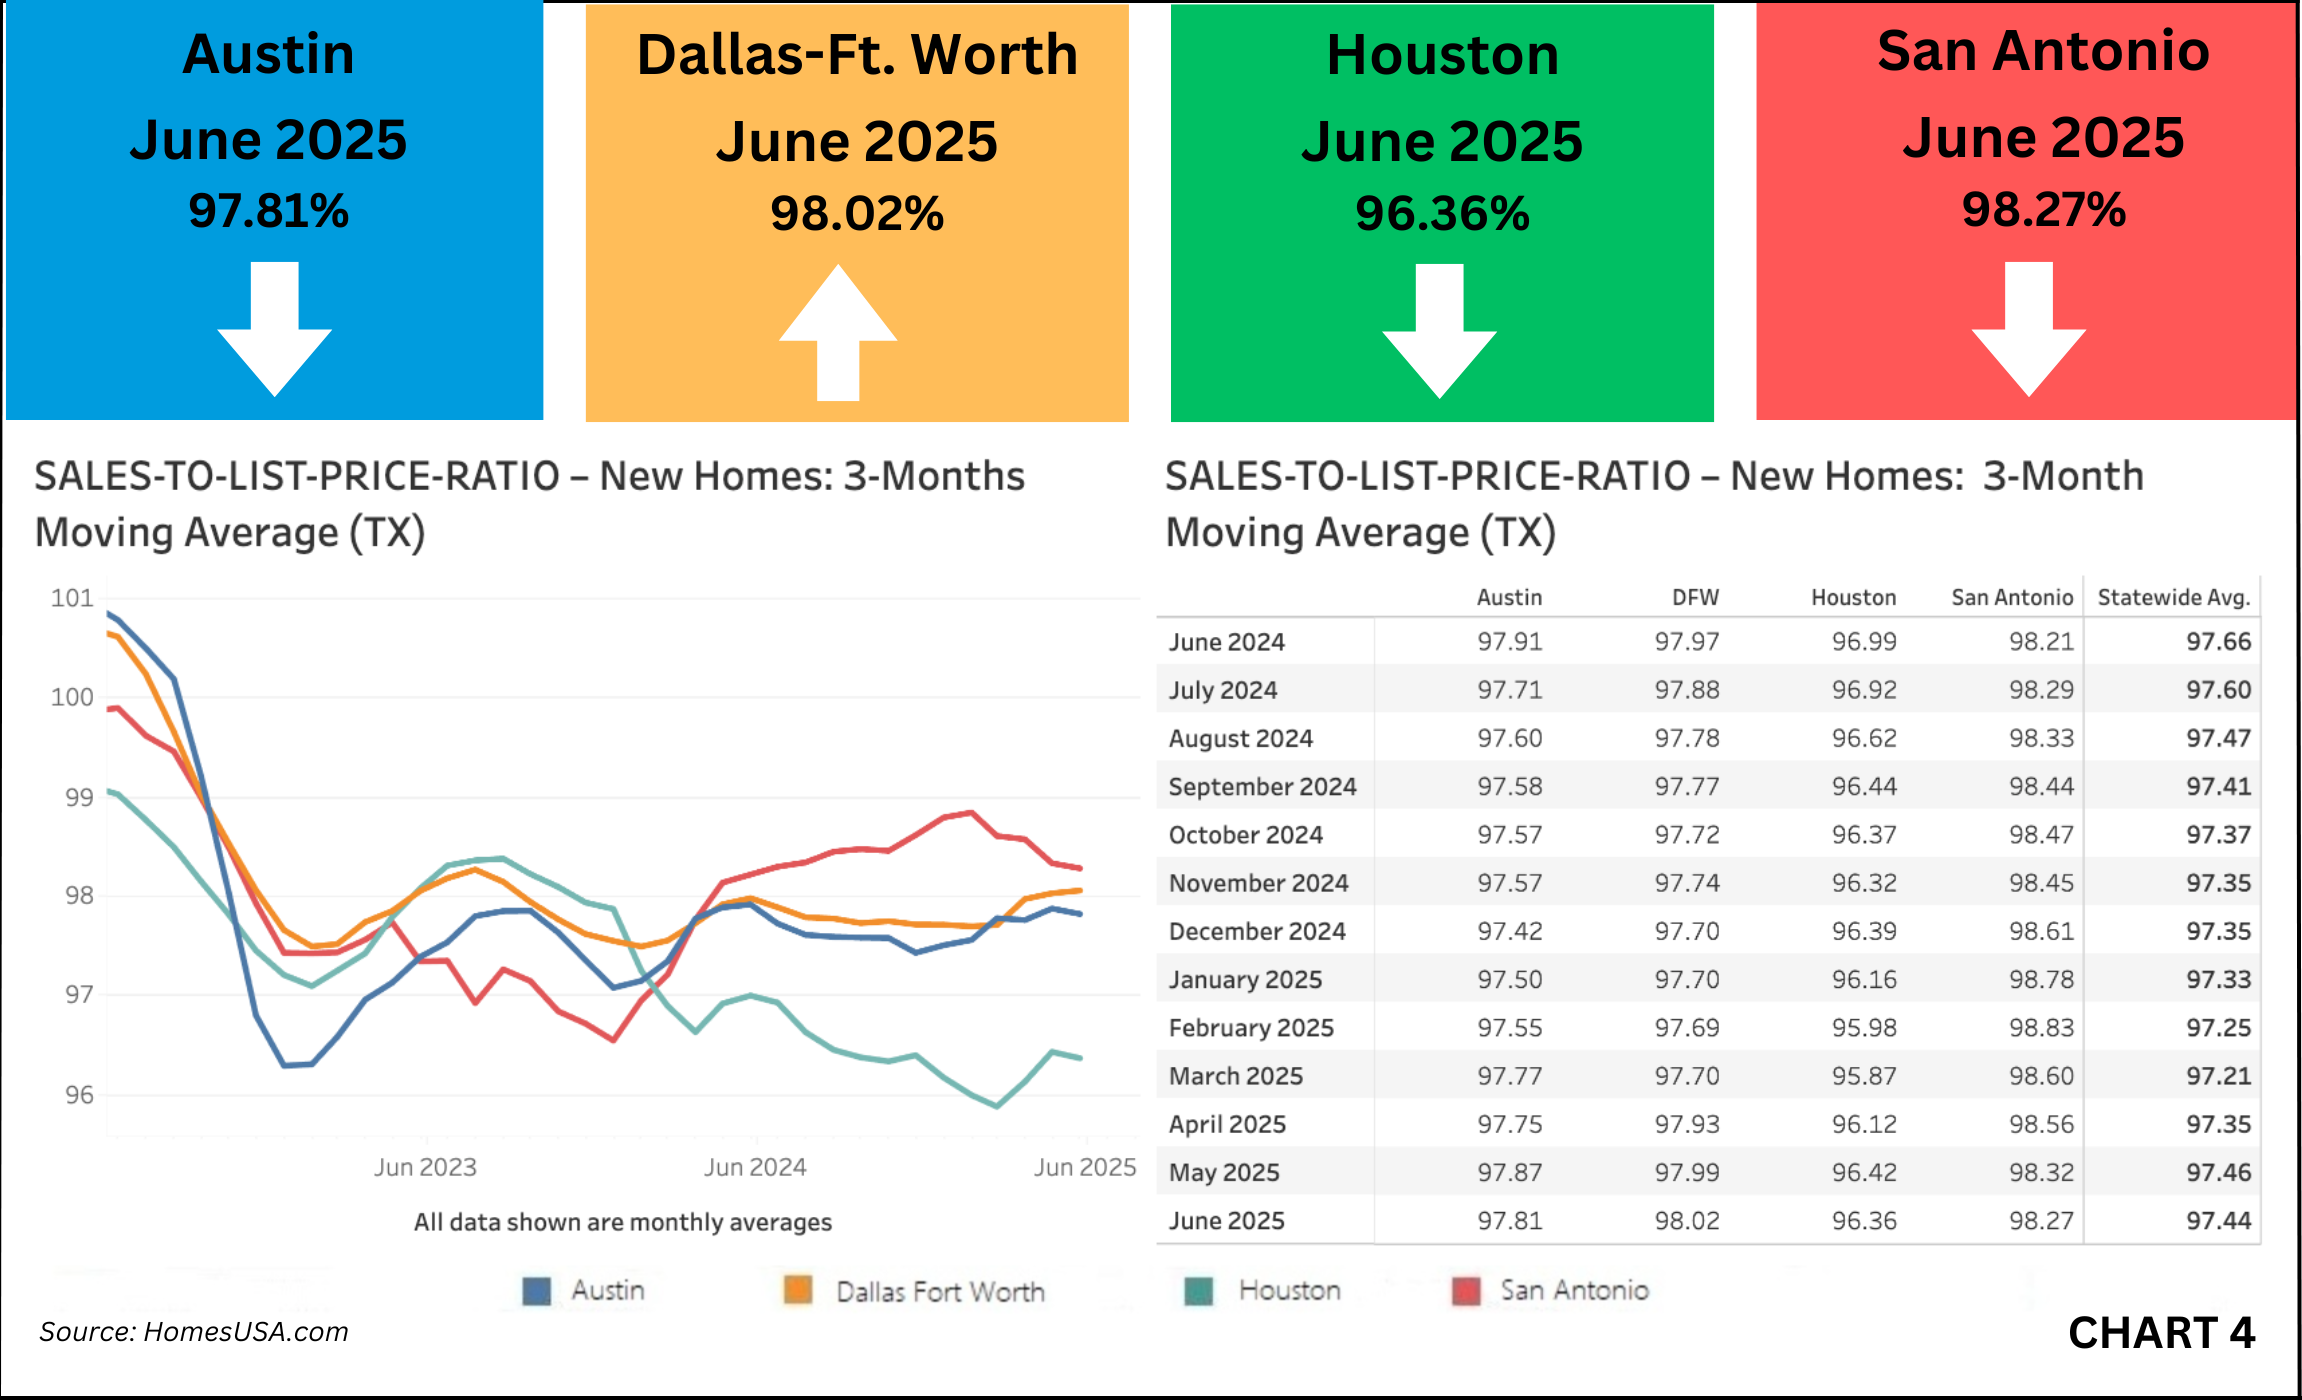
Texas Sales-to-List Price Ratio Holds Steady
The statewide sales-to-list price ratio for new homes remained consistent. The 3-month moving average in June was 97.44 percent, nearly identical to 97.46 percent in May. Dallas-Ft. Worth’s ratio was 98.02 percent, slightly higher than 97.99 percent the previous month. Houston posted a ratio of 96.36 percent, down from 96.42 percent. Austin’s ratio was 97.81 percent, dipping slightly from 97.87 percent in May, while San Antonio’s ratio was 98.27 percent, also down modestly from 98.32 percent. (See Chart 4: Texas Sales-to-List Price Ratio)
Texas Pending New Home Sales Decreases
Pending new home sales – an important future indicator of market activity – declined in all four major Texas markets last month. The 3-month moving average statewide fell to 7,068 in June from 7,437 in May. Dallas-Ft. Worth’s pending sales dropped to 2,595 from 2,692. Houston slipped to 2,254 from 2,350. Austin saw the smallest drop, with pending sales falling to 1,190 from 1,276, and San Antonio’s average fell to 1,029 from 1,119. (See Chart 5: Texas Pending New Home Sales)
Texas Active Listings for New Homes Continues to Grow
Active new home listings increased across all four of the state’s largest new home markets in June. The 3-month average statewide rose to 34,203 from 33,710 in May. Dallas-Ft. Worth’s inventory increased to 8,497 from 8,288, while Austin rose slightly to 5,913 from 5,862. San Antonio’s active listings climbed to 5,465 from 5,289, and Houston continued to lead the state, with 14,328 active listings, up from 14,271. (See Chart 6: Texas Active Listings)
About the HomesUSA.com New Home Sales Index
The HomesUSA.com Index is reported as both a 3-month and 12-month moving average of the Days on Market for new homes listed in the local Multiple Listing Services (MLSs) for Dallas-Ft. Worth, Houston, Austin, and San Antonio. Created by Ben Caballero, it is the first Days on Market index to track the Texas new home market and includes homes listed while under construction. (See Chart A: 12-Month Moving Averages)
*Note: Texas “statewide” data denotes a combination of its four largest new home markets – Houston, Dallas-Ft. Worth, Austin, and San Antonio – which comprise the vast majority of new home sales and MLS data statewide.
About Ben Caballero and HomesUSA.com®
Ben Caballero, founder and CEO of HomesUSA.com, is a three-time Guinness World Records title holder for ‘Most annual home sale transactions through MLS by an individual sell-side real estate agent – current. Ranked by REAL Trends as America’s top real estate agent for home sales since 2013, Ben is the most productive real estate agent in U.S. history. He is the only individual real estate agent to reach nearly $4 billion in residential sales transactions in a single year ($3.93 billion in 2024), the first agent to exceed $3 billion (2022), the first to exceed $2 billion (2018, 2019, 2020), and the first to exceed $1 billion (2015, 2016, 2017). Ben, an award-winning innovator and technology pioneer, works with more than 60 home builders in Dallas-Fort Worth, Houston, Austin, and San Antonio. His podcast series is available widely, including iTunes, Spotify and YouTube. Learn more at HomesUSA.com |Twitter: @bcaballero - @HomesUSA | Facebook: /HomesUSAdotcom.
Note for journalists: You may contact Ben Caballero directly by email at ben@homesusa.com.
REALTOR® is a federally registered collective membership mark which identifies a real estate professional who is a member of the NATIONAL ASSOCIATION OF REALTORS® and subscribes to its strict Code of Ethics.
Media Contact:
Kevin Hawkins
(206) 866-1220
kevin@wavgroup.com
Image: Ben Caballero
https://bit.ly/ben-caballero-photo
Individual Chart images:
Chart 1: Days on Market – Thru June 2025: https://homesusa.com/wp-content/uploads/2025/07/Chart-1-Texas-New-Homes-Tracking-Days-On-Market.png
Chart 2: New Home Sales – Thru June 2025: https://homesusa.com/wp-content/uploads/2025/07/Chart-2-Texas-New-Home-Sales-Market.png
Chart 3: Sales Prices – Thru June 2025: https://homesusa.com/wp-content/uploads/2025/07/Chart-3-Texas-New-Home-Sales-Prices-Market.png
Chart 4: Sales-to-List-Price Ratio – Thru June 2025: https://homesusa.com/wp-content/uploads/2025/07/Chart-4-Texas-Sales-to-List-Price-Ratio-Market.png
Chart 5: Pending New Home Sales – Thru June 2025: https://homesusa.com/wp-content/uploads/2025/07/Chart-5-Texas-Pending-New-Home-Sales-Market.png
Chart 6: Active Listings – Thru June 2025: https://homesusa.com/wp-content/uploads/2025/07/Chart-6-Texas-Active-Listings-for-New-Homes-Market.png
Chart A: 12-Month Moving Averages – Thru June 2025: https://homesusa.com/wp-content/uploads/2025/07/Chart-A-12MonthChart-DataOnly.jpg

![]()