
I asked if gold found a bottom in an April 2, 2026, Barchart article, concluding with the following:
After correcting from the late January record high, a scale-down buying approach, leaving plenty of room to add on further declines, could be optimal, as gold’s bull market remains firmly intact in April 2026.
Don’t Miss a Day: From crude oil to coffee, sign up free for Barchart’s best-in-class commodity analysis.
Gold traded at $4,689.60 per ounce on April 2, 2026, and was lower than that price on May 4, 2026. Time will tell if the $4,550 level is inexpensive as gold continues to consolidate.
Consolidation above the March low
After falling to a $4,100 low on March 23, 2026, it consolidated around the $4,800 level in April.
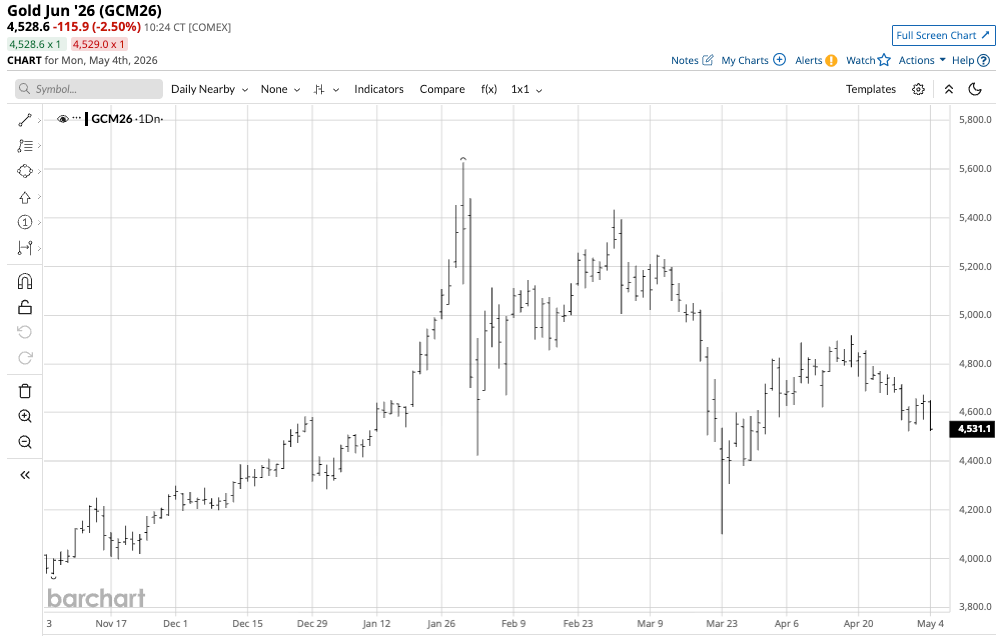
The daily continuous COMEX gold futures contract chart shows that $4,800 became a pivot point for gold, with the price consolidating between $4,522.20 and $4,917.70 throughout April 2026. While the April low was $422.20 above the March 23 low and technical support level, the April high was $1,059.20 below the January 29, 2026, all-time peak and technical resistance level.
J.P. Morgan’s forecast is very bullish
In late February 2026, J.P. Morgan, one of the world’s leading financial institutions and a leading gold bullion dealer, forecast that it sees “demand from central banks and investors this year ultimately pushing gold prices to $6,300 an ounce by the end of 2026.”
The gold bull market that began in 1999 and became parabolic in 2024, 2025, and January 2026 may have corrected from the latest high, but many analysts and market participants believe the current consolidation is but a rest period before another leg higher.
Wells Fargo strategists recently forecast that the price could surge to $8,000 per ounce.
Central banks continue to add to reserves
One of the primary factors accounting for gold’s ascent has been years of central bank gold accumulation. Central banks have been net buyers of gold since 2010, with net purchases from 2022 to 2024 exceeding 1,000 metric tons. In 2022, central banks purchased 1,136 tons, the highest amount since 1950. From 1989 to 2009, central banks had been net sellers of the precious metal.
Russia and China have been the leading purchasers, but their accumulation is likely understated as they are major gold-producing countries that do not publish official stockpile data for national security reasons. However, Russia and China likely vacuumed domestic production, boosting their gold holdings above the published data.
Meanwhile, the recent price decline has encouraged continued buying, with the World Gold Council reporting that central banks purchased a net 27 tons in February 2026, with Poland the most active, adding 20 tons to reserves.
Central banks, governments, monetary authorities, and supranational institutions continue to validate gold’s role in the global financial system. For individual investors and traders, ETF products such as GLD, with over $157.4 billion in assets under management, and the many other gold-related market products have only increased participation in the world’s oldest asset and store of value.
Oil’s inverse relationship with gold has been a roadblock
While gold has a long history as an inflation barometer, recent price action has run counter to this. Since late February 2028, the situation in the Middle East, which has pitted the U.S. against Iran, closed the Strait of Hormuz, and prompted Iran to retaliate against many countries across the Region, has driven crude oil prices to soar. Crude oil remains the energy commodity that powers the world, and rising crude oil prices increase global inflationary pressures. However, gold prices have entered a countercyclical pattern, rising when oil prices fall and vice versa.
Meanwhile, since gold prices have been rallying for years and the rally turned parabolic until January 2026, risk-off price action driven by crude oil’s rise and geopolitical uncertainty has likely led to some liquidation of long gold positions. The correction from the late January high and long-term technical support, which is far below the current price and even the recent $4,100 low, has likely encouraged market participants holding long positions to liquidate and take profits. In the official sector, increased military spending could limit funds available for gold purchases.
Over the past weeks, despite a ceasefire, uncertainty over the future of hostilities in the Middle East has led to an inverse correlation between oil and gold prices, which has become a roadblock to a return to higher gold prices.
The odds favor higher gold, but a rally could come from a lower level
It is impossible to pick tops or bottoms in any market during rallies and corrections, and gold is no exception. A few short years ago, no leading analyst forecast that gold prices would rise to over $5,600 per ounce. During bullish and bearish periods, prices often rise or fall to levels that can defy reasonable, rational, and logical technical and fundamental analysis.
While $4,100 per ounce is gold’s current short-term technical support, longer-term support for the over quarter-of-a-century gold bull market is far lower. Therefore, a deeper correction could occur if some of the accumulation over the past years turns to profit-taking and dishoarding.
However, the factors supporting higher gold prices, including but not limited to rising debt levels, declining fiat currency values, the bifurcation of the world’s nuclear powers, increasing geopolitical tensions, rising inflationary pressures, and unforeseen events, are compelling. Central banks and governments continue to validate gold as the ultimate reserve asset, as it has replaced the euro as the second-most-held reserve asset. As long as gold remains a top reserve asset, it will remain a store of value. I remain bullish on gold, but would leave room to add to existing long positions on further declines.
On the date of publication, Andrew Hecht did not have (either directly or indirectly) positions in any of the securities mentioned in this article. All information and data in this article is solely for informational purposes. For more information please view the Barchart Disclosure Policy here.